Ofqual Analytics
Ofqual Analytics presents a selection of interactive visualisations to allow users to explore the data Ofqual collects on the qualifications system in England.
About our data and statistics
We at Ofqual collect data from awarding organisations and produce statistics on the qualifications we regulate.
To offer a transparent and engaging way to access our data and statistics, we publish a number of interactive visualisations. In this way, you can explore the data depending on your interests and needs. Each interactive visualisation is updated with the latest data as soon as it becomes available.
You can access the full range of our statistical publications and research reports on the Ofqual homepage. Some of our analytics also feature in the Ofqual blog.
Spotlight
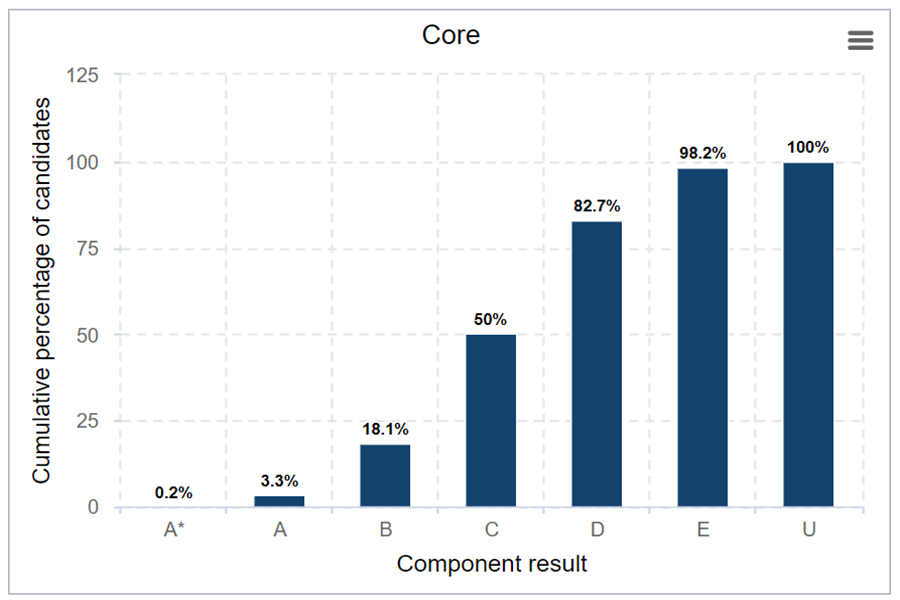
GCSE: grade outcomes
Interactive visualisations
Our interactive visualisations are organised by qualification level. To explore data and produce insights, please start by selecting the group of qualifications you are interested in.
The interactive visualisations contained in this section are specific to level 1, level 1/2 and level 2 qualifications only.
More visualisations relating to all qualification levels including level 1, level 1/2 and level 2 can also be found in the all qualification levels section below.
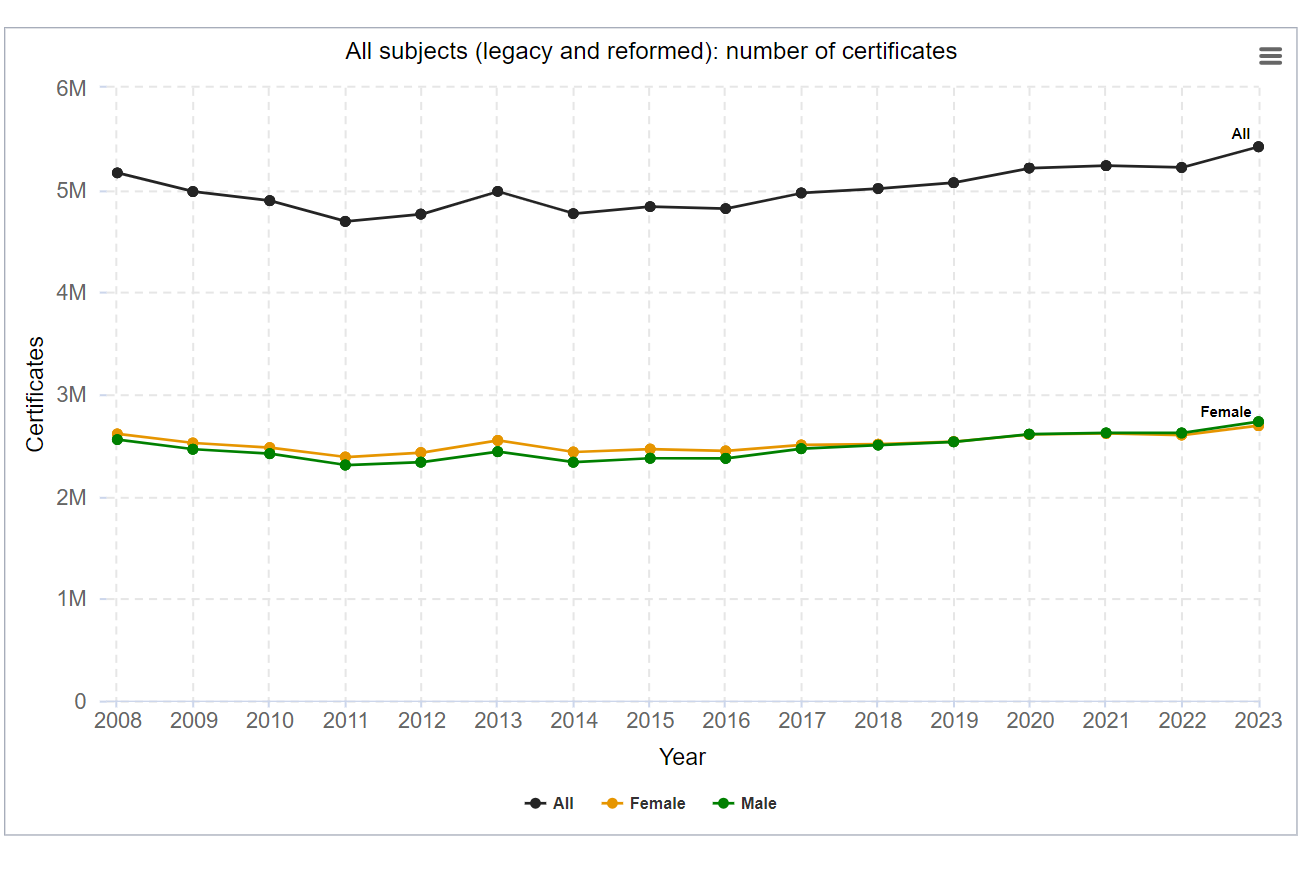
GCSE: grade outcomes
GCSE outcomes across different subjects
Last updated on 21 August 2025
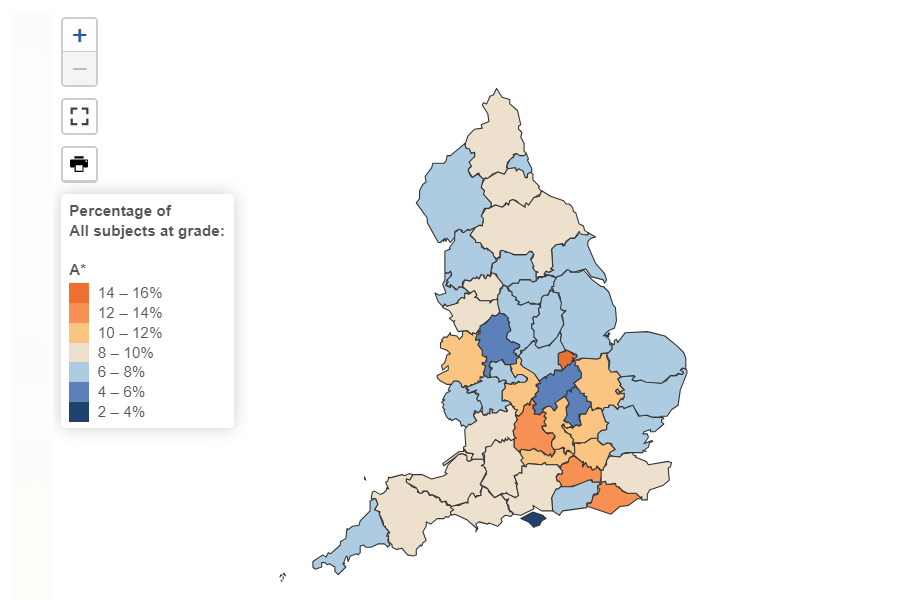
GCSE: grade outcomes by county
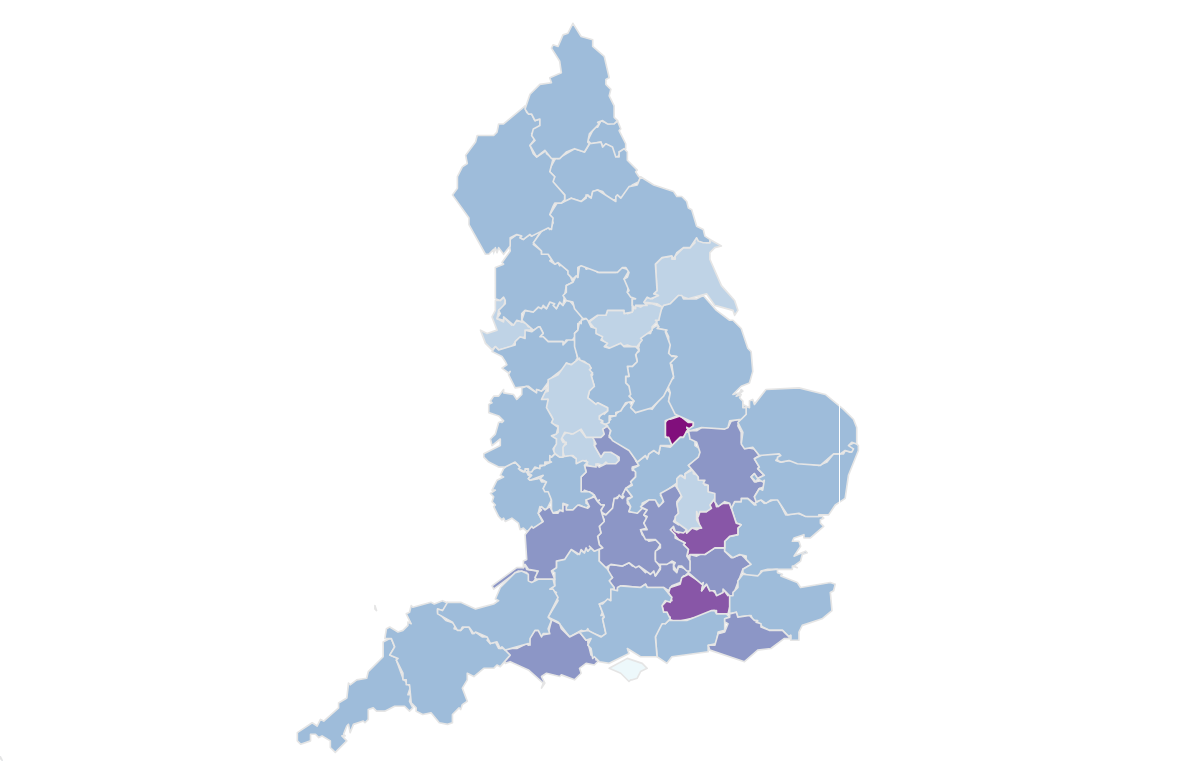
GCSE grade outcomes by subject in England counties
Last updated on 21 August 2025
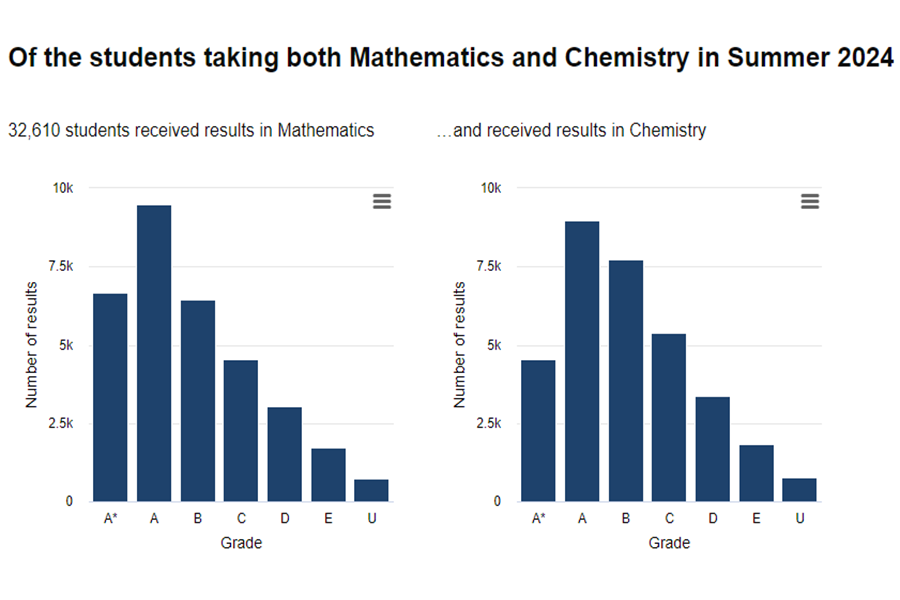
GCSE: subject combinations and outcomes
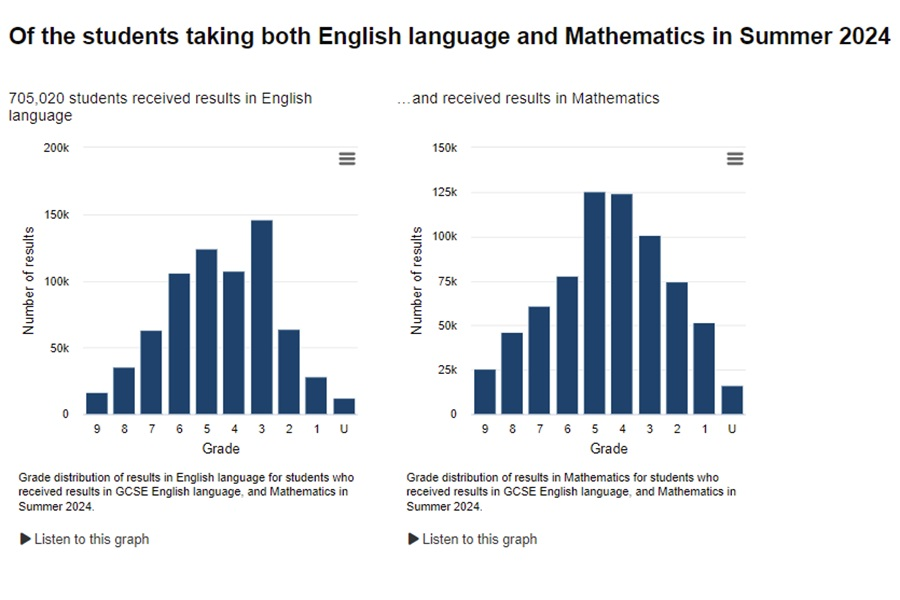
Grade distributions for different combinations of GCSE subjects
Last updated on 21 August 2025
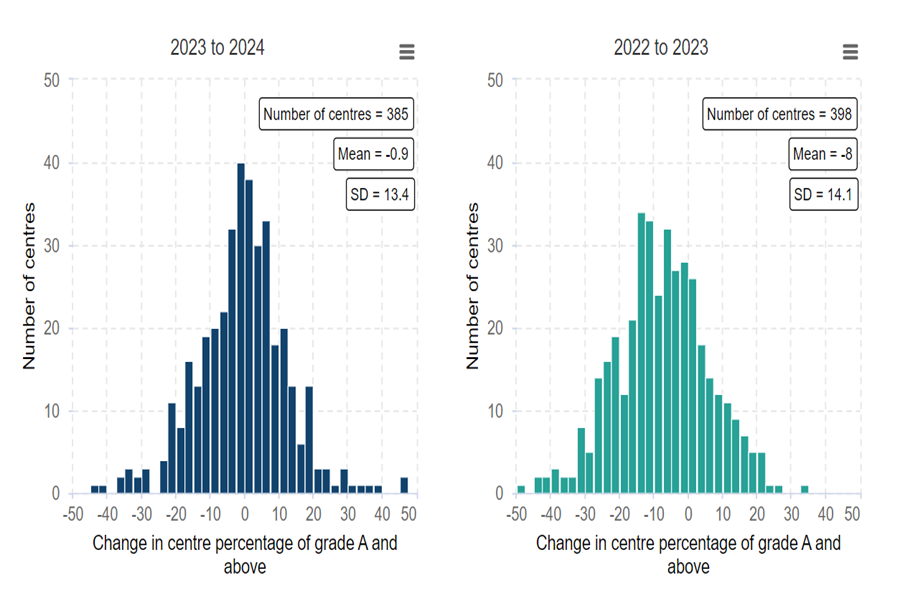
GCSE: variability in centres
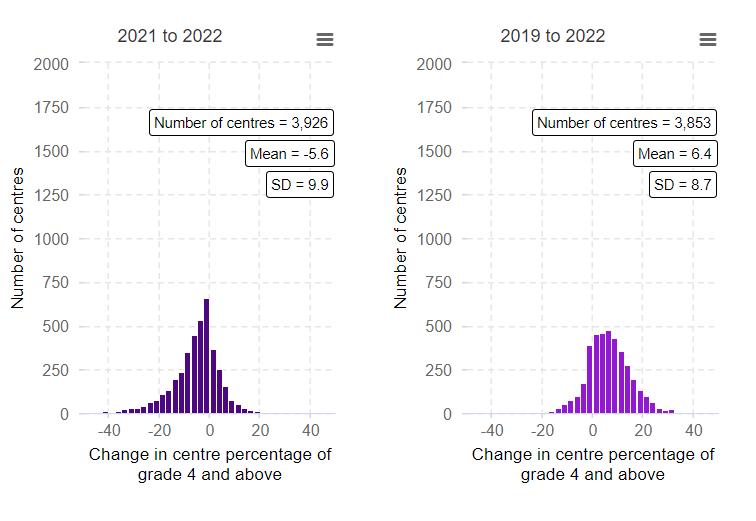
Variability in GCSE results for schools and colleges
Last updated on 21 August 2025
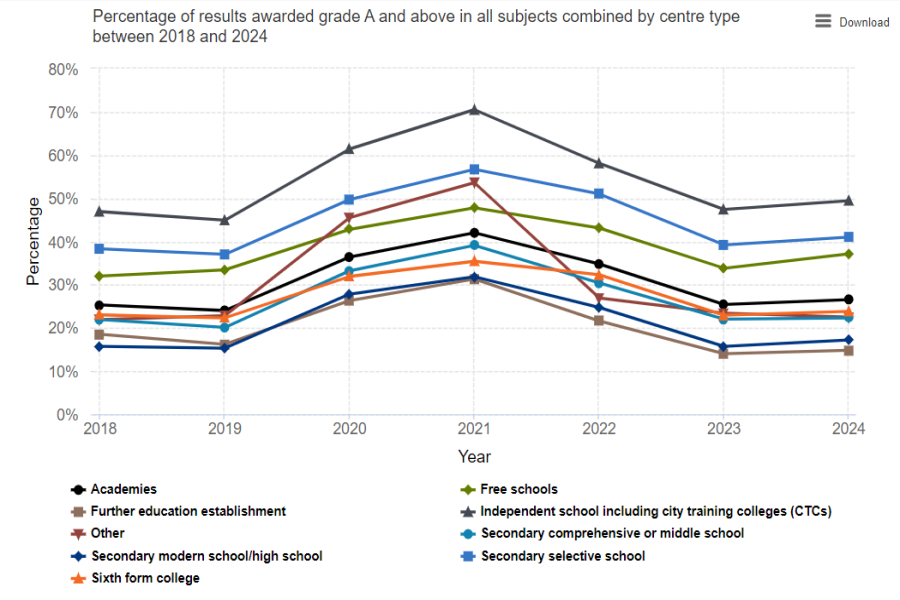
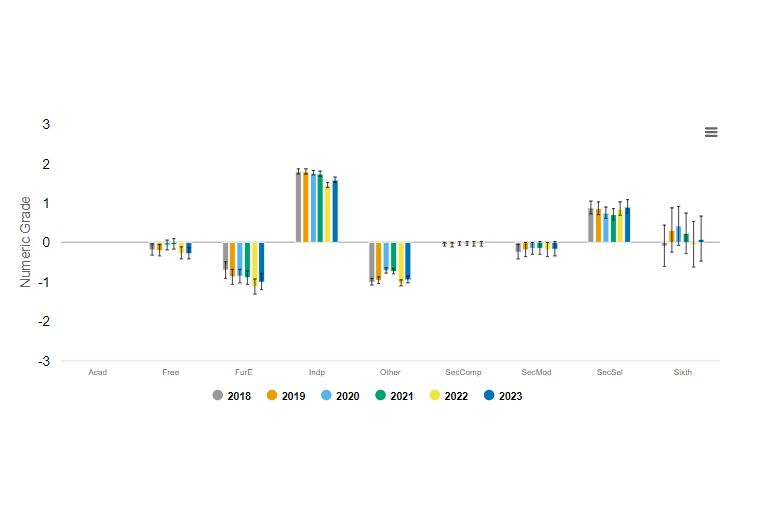
GCSE: outcomes by centre type
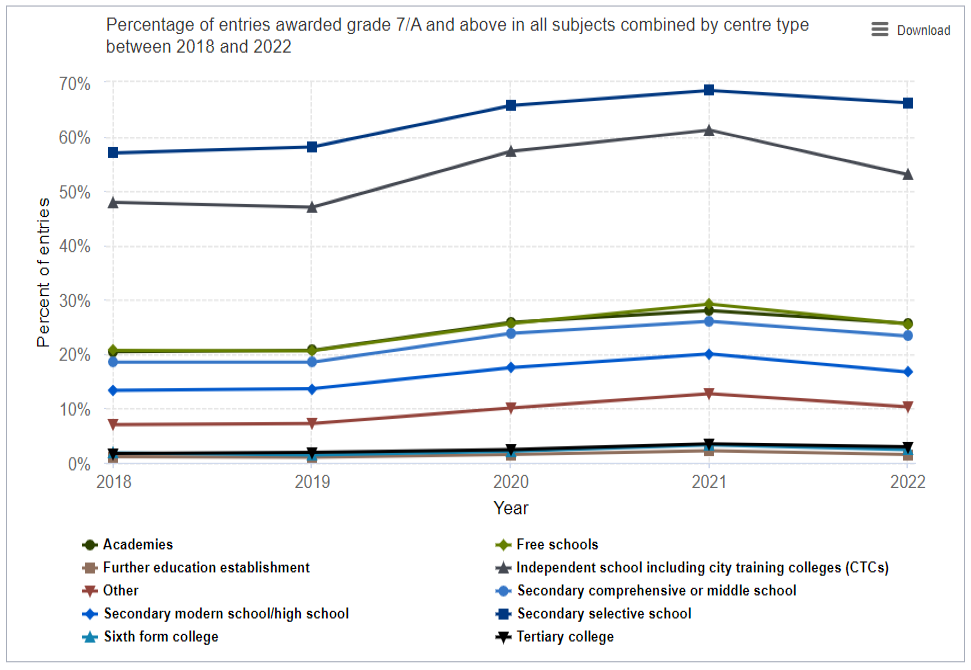
GCSE outcomes by type of school or college
Last updated on 21 August 2025
PTQ Level 1/2 outcomes
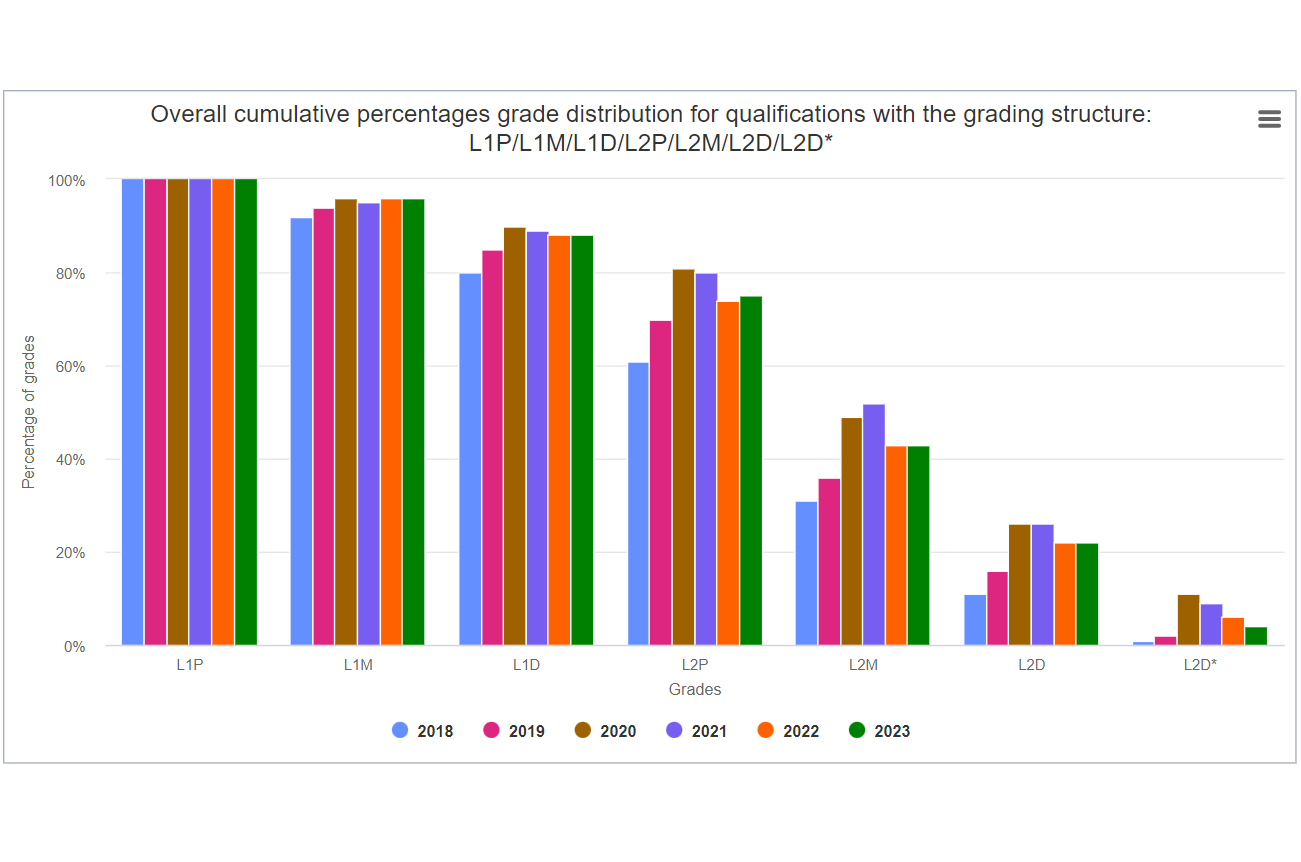
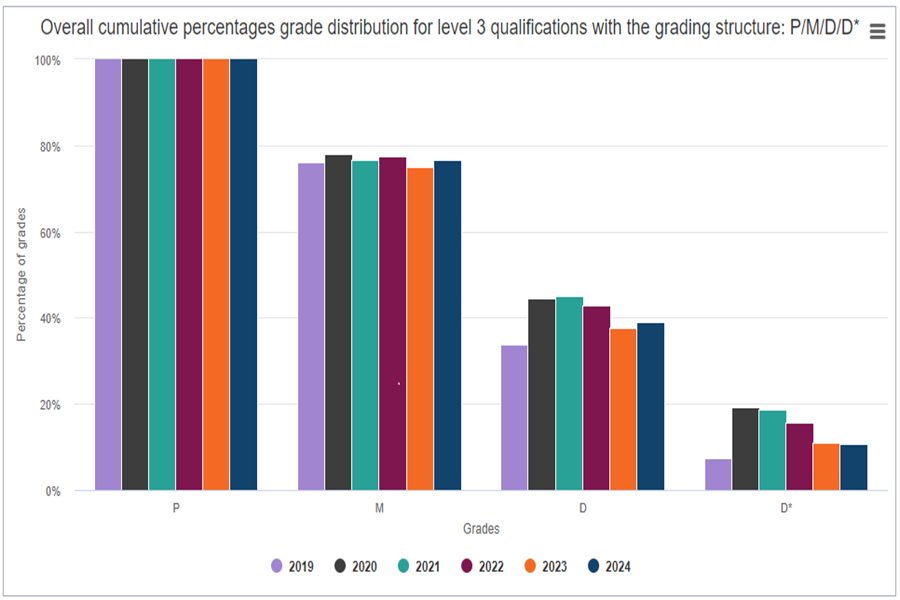
Level 1, level 1/2 and level 2 Vocational and Technical Performance Table Qualifications (PTQs) grade outcomes
Last updated on 1 December 2025
Functional Skills Qualification (FSQ) outcomes
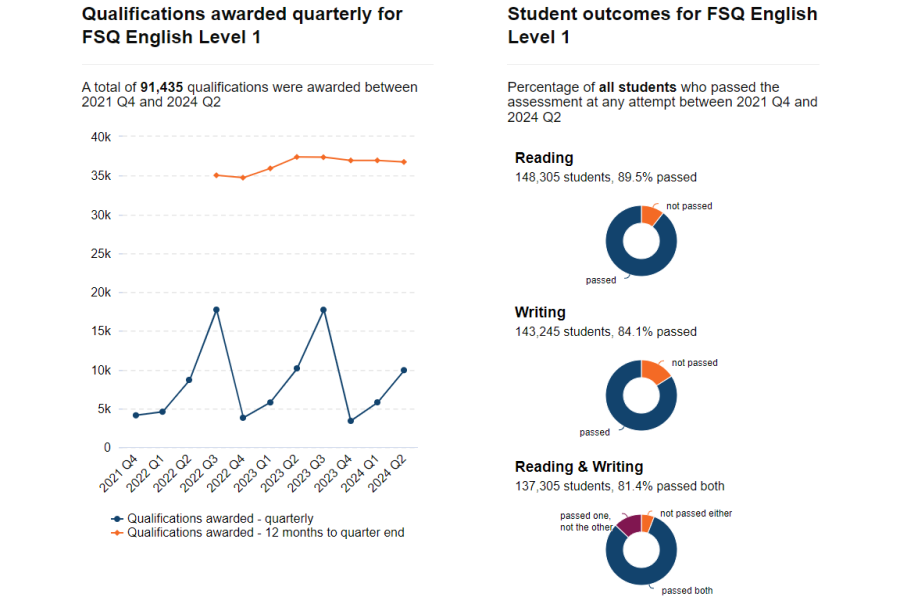
Functional Skills Qualification (FSQ) outcomes in English and maths
Last updated on 18 May 2026
The interactive visualisations contained in this section are specific to level 3 qualifications only.
More visualisations relating to all qualification levels including level 3 can also be found in the all qualification levels section below.
A level: grade outcomes
A level outcomes across different subjects
Last updated on 14 August 2025
A level: subject combinations and outcomes
Grade distributions for different combinations of A level subjects
Last updated on 14 August 2025
A level: grade outcomes by county
A level grade outcomes by subject in England counties
Last updated on 14 August 2025
A level: variability in centres
Variability in A level results for schools and colleges
Last updated on 14 August 2025
A level: outcomes by centre type
A level outcomes by type of school or college
Last updated on 14 August 2025
The interactive visaualisations contained in this section relate to multiple qualification levels.
For more visualisations relating to specific qualification levels, see the sections above.
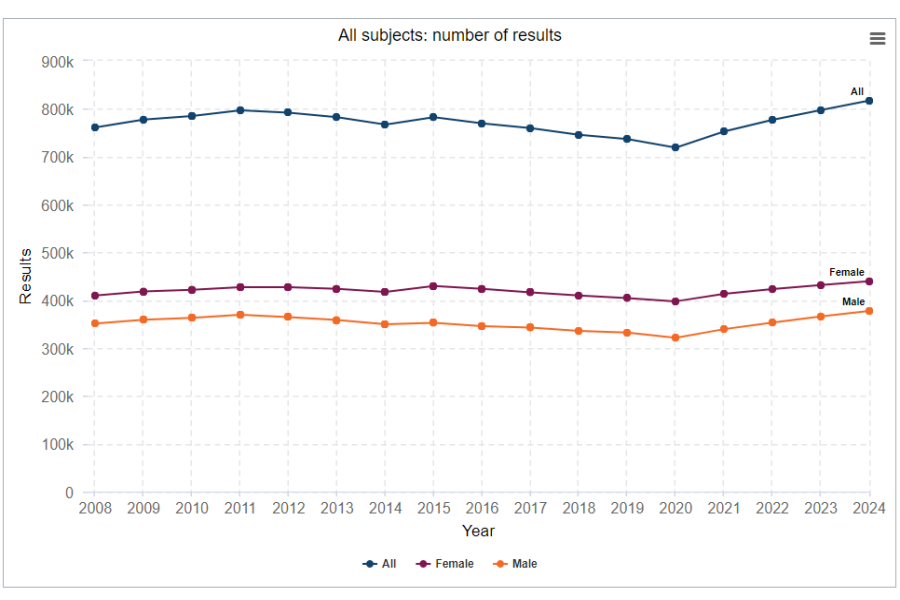
Summary statistics for GCSE, AS and A level
Main trends related to qualifications and assessments
Last updated on 2 December 2025
Equalities analyses for GCSE, A level and VTQs
Interactive report of student-level equalities analyses for GCSE, A level and VTQs
Last updated on 3 December 2025
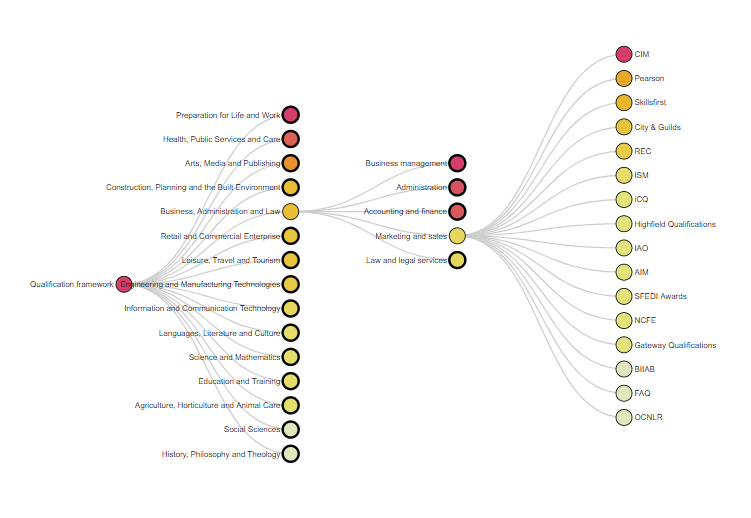
All regulated qualifications landscape
All qualifications regulated by Ofqual
Last updated on 2 April 2026
Vocational and other qualifications over time
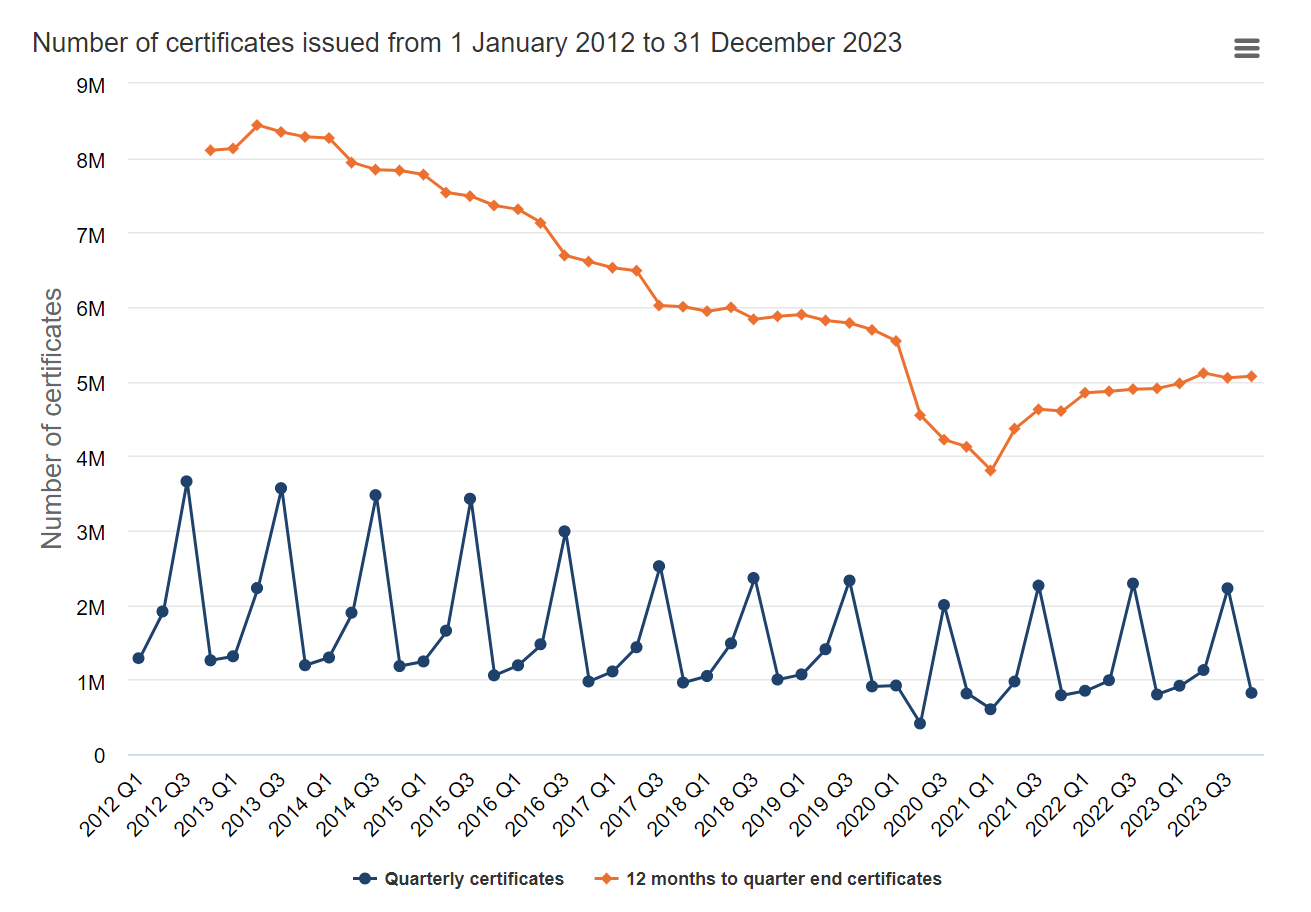
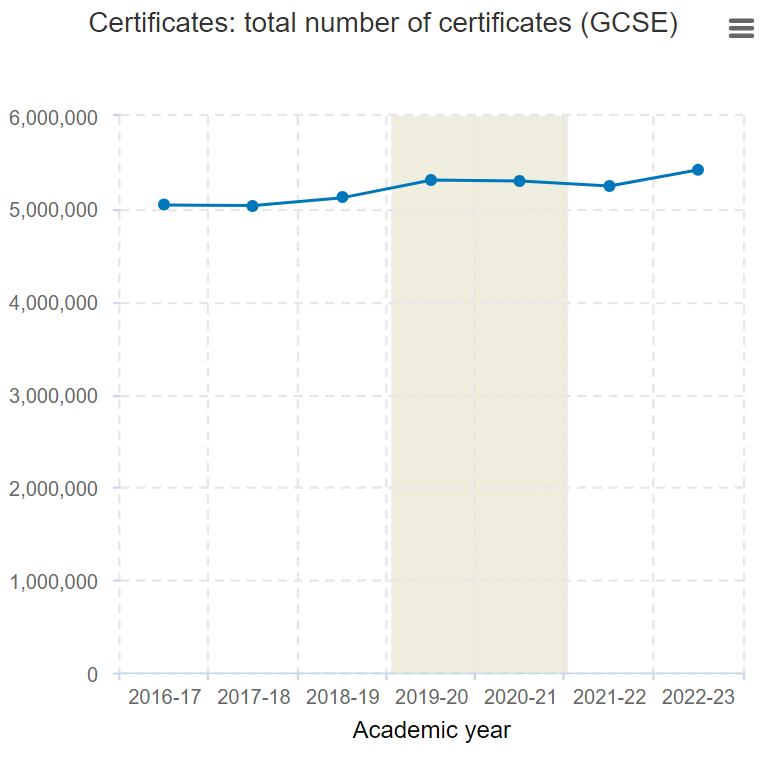
Number of certificates awarded since 2012
Last updated on 11 June 2026
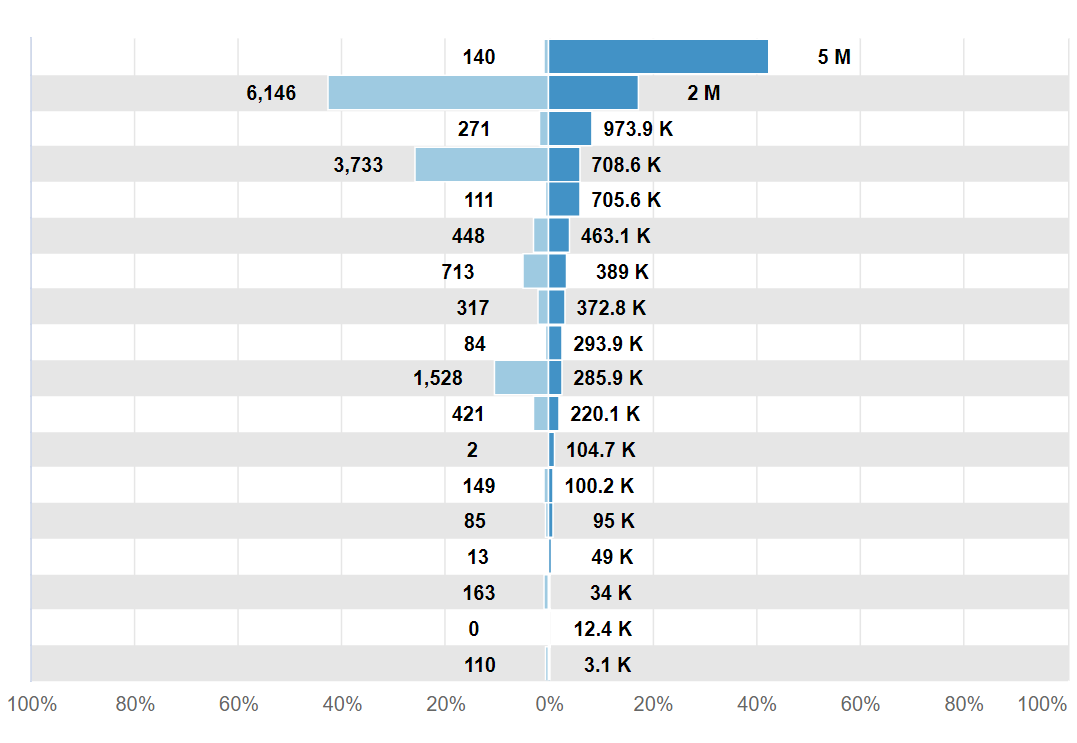
VTQ: qualifications landscape
Vocational and technical qualifications regulated by Ofqual
Last updated on 21 November 2024
Qualification Price Statistics
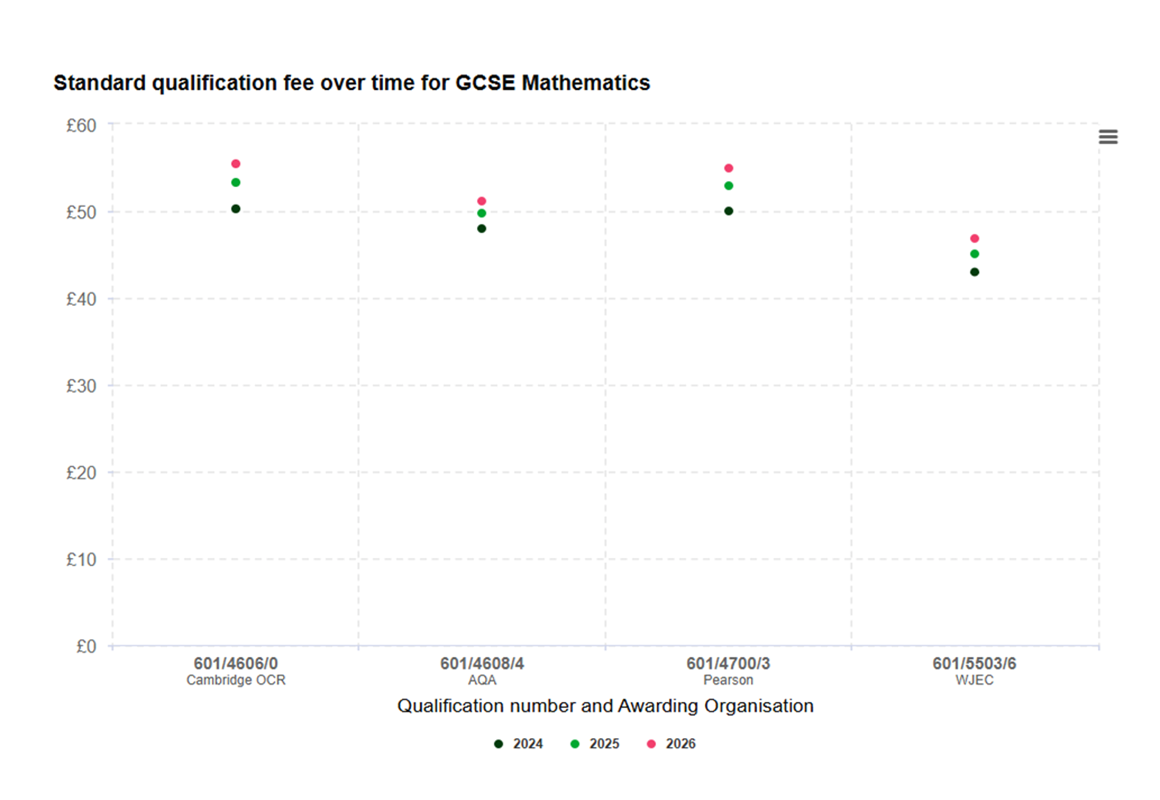
Price statistics and market share for GCSEs, AS and A levels
Last updated on 13 May 2026
We are committed to make our interactive visualisations as engaging and accessible as possible. If you have any comments on the design, usability or content of these interactive analytics, please contact us at [email protected].